Helpful information
Additional Models for Braitenberg Husky experiments
The Husky examples, examples/husky_braitenberg and examples/husky_braitenberg_nest_server, require additional gazebo models that are not included in the NRP-core repository. These assets can be found in other NRP repositories, and the instructions below show how to download and make them available to gazebo.
# Create a new directory, for example in your home directory:
mkdir ${HOME}/nrp
cd ${HOME}/nrp

# Clone our repositories that contain the necessary assets:
git clone https://@bitbucket.org/hbpneurorobotics/models.git
git clone https://@bitbucket.org/hbpneurorobotics/gzweb.git

#Export your NRP-core installation directory as HBP. This variable will be needed to create symlinks to gazebo models
export HBP=/home/${USER}/.local/nrp

# Create necessary directories for gazebo models and gzweb assets:
mkdir -p ${HBP}/gzweb/http/client/assets
mkdir ${HOME}/.gazebo/models

# Run the create-symlinks.sh script from the models repository. This will create necessary symlinks
# to the models in .gazebo/models, and to the assets in ${HBP}/gzweb/http/client/assets

cd models
./create-symlinks.sh
Now it should be possible to run the Husky experiments!
Recording progress and generating videos of Gazebo simulation
To record progress of a simulation in Gazebo, the following command line arguments can be used:
-r- enables recording of simulation state data. By default, the data is saved in$HOME/.gazebo/log/directory--record_path <path>- absolute path in which to store the recorded data
These options should be added to the Gazebo engine configuration section in the simulation configuration, under the EngineProcStartParams parameter:
"EngineProcStartParams": ["--verbose -r --record_path=/home/nrp/nrp-core/examples/husky_braitenberg"]
In order to replay the simulation, gazebo executable should be called with the recording arguments mentioned above replaced with -u -p <log_file>, and with the rest of arguments matching exactly the arguments used during the recording:
gazebo --verbose -u -p state.log --engine=gazebo --serverurl=localhost:9004 --protobuf_plugins_path=/home/nrp/.local/nrp/lib --protobuf_plugins='["Gazebo"]' -s NRPGazeboGrpcCommunicationPlugin.so --seed 0 husky_world.sdf
The full command can be printed during NRPCoreSim execution by adding --cloglevel=debug argument.
It is possible to record a video by clicking the Record a video button visible on the top right part of the gazebo GUI during the replay of simulation.
More information about gazebo logging can be found at the following page.
Time Profiling NRPCore Experiments
Some basic tools are included for time profiling the execution of NRPCore experiments. They can be used to debug bottlenecks in the execution.
In order to enable time profiling, nrp-core must be configured with -DENABLE_TIME_PROFILE=ON :
cmake -DENABLE_TIME_PROFILE=ON <other configuration parameters> ..
see this page for more details.
After this is done, running an NRPCore experiment will generate a set of log files containing profiling information. The files are stored in a directory: <experiment_folder>/time_logs<time_stamp>. Each of these files contain a list of time points (one for each simulation loop step) corresponding to each of the sub-steps in a loop step. More information about the simulation loop step structure can be found in this Simulation Loop step structure page. All the time data is express in microseconds wrt a fixed time point with no relevance. Thus, data is meant to analyzed by comparing time differences between the same rows of different files.
The files containing simulation loop sub-step temporal information are:
step_start.log: marks the start of the simulation loop step
after_wait_for_engines.log: time after engines which are being synced in this step has finished their simulations
after_get_datapacks.log: time after required datapacks have been received from the corresponding Engines
after_run_tfs.log: time after PFs and TFs have been executed
after_send_datapacks.log: time after datapacks returned by TFs have been sent to the corresponding Engines
after_restart_engines.log: time after synced Engines have been re-started
Additionally, two files containing processed data are stored:
step_duration.log: contains the list of simulation loop step durations in microseconds. Corresponds to
after_restart_engines - step_startin the aforementioned filesexperiment_stats.log: contains the full run time of the NRPCoreSim process plus the duration of each of the calls to the SimulationManager lifecycle transitions
A python script is provided to plot logged profiling data. It can be found at tools/python plot_sim_loop.py. It takes as argument a list of directories separated by spaces containing profiling data generated by NRPCore. It plots a graph with the duration of each simulation loop sub-steps in milliseconds and prints some stats from this data. The maximum number of log directories that can be plotted together is four.
As an example, below is shown a plot from a run of the examples/husky_braitenberg experiment:
And the accompanying printout stats from the script:
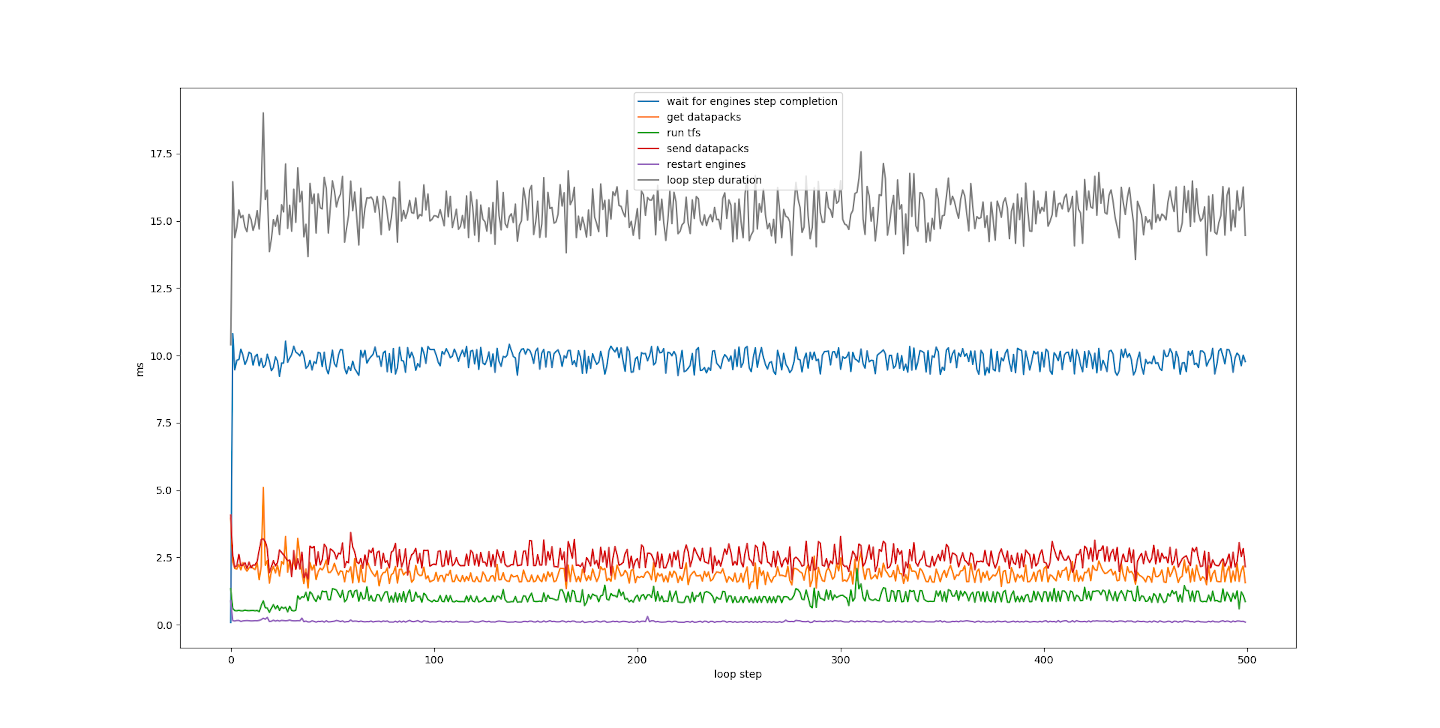
NRPCoreSim execution time: 11183.743 (ms)
Initializing Simulation: 3092.096 (ms)
Running Simulation: 7681.026 (ms)
Shutting down Simulation: 62.319 (ms)
Shutting down Simulation: 0.069 (ms)

loop step duration (mean): 15.342966 (ms)
wait for engines step completion (mean): 9.843093999999999 (ms)
get datapacks (mean): 1.885496 (ms)
run tfs (mean): 1.004954 (ms)
send datapacks (mean): 2.465828 (ms)
restart engines (mean): 0.120026 (ms)
The script has some dependencies which are not installed during the nrp-core installation guide, you might need to install them manually before running the script.